Fish Heat Maps for Trip Planning
Visualize modeled planning zones that help you compare areas for your target species
How Fish Fathom Builds Heat Maps
Data Input
Fish Fathom reviews NOAA fish survey data including catch locations, species counts, sizes, and environmental conditions.
Pattern Modeling
Models identify patterns and correlations between fish abundance and habitat characteristics.
Planning Signal
The model estimates relative planning strength for each species based on historical data and conditions.
Visual Heat Map
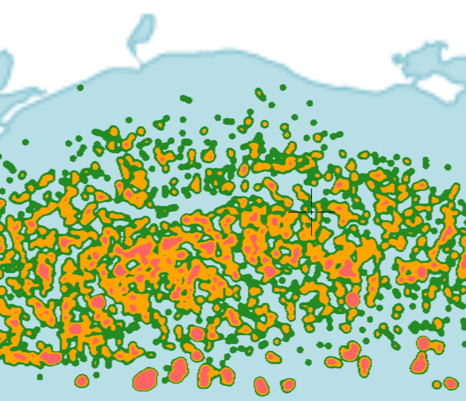
Signals are rendered as color-coded heat maps so you can compare stronger and weaker planning context at a glance.
Understanding Planning Zones
Hot Zones (Red)
Stronger Signal: Areas with more supporting data for the selected species. Treat these as starting points, not guarantees.
Warm Zones (Orange)
Moderate Signal: Useful secondary areas to compare when conditions, pressure, or access change.
Moderate Zones (Yellow)
Lower Signal: Areas with some supporting context that may still be worth reviewing with local knowledge.
Cool Zones (Blue)
Limited Signal: Areas with less supporting model context for the selected species.
Heat Maps by Species
Each species has unique habitat preferences and distribution patterns. Fish Fathom builds separate heat map context for each species.
🔴 Red Snapper
Structure-oriented species found near reefs, ledges, and artificial structure in 40-200 ft depths.
Plan Gulf red snapper trips🟤 Red Grouper
Bottom dwellers preferring hard structure and rocky areas in 60-300 ft depths throughout the Gulf.
Plan Gulf red grouper trips🟢 Gag Grouper
Found near structure in 20-150 ft depths, especially around ledges and outcroppings.
Plan Gulf gag grouper trips🟡 Yellowedge Grouper
Deep water species typically found in 200-600 ft depths along steep ledges and drop-offs.
Kingfish
Pelagic Gulf planning often benefits from comparing water context, route options, and weather windows.
Plan Gulf kingfish tripsHow to Use Heat Maps
gps_fixedTarget Specific Species
Select the species you want to target and use the heat map to compare areas worth investigating.
searchFind Hot Spots
Quickly identify stronger modeled areas so you can plan a more focused route.
calendar_monthSeasonal Patterns
Heat maps reveal seasonal migration patterns - see where fish move throughout the year based on historical data.
mapPlan Multi-Species Trips
Overlay multiple species heat maps to find areas where several target species overlap for productive mixed-bag fishing.
local_gas_stationSave Fuel & Time
Use stronger modeled zones to narrow your search before committing fuel and time.
emoji_eventsIncrease Success Rate
Use modeled context as one input alongside structure, conditions, regulations, and local judgment.
Why Heat Maps Work
- ✓Based on Real Data: Heat maps are generated from official NOAA survey data, not guesses or crowd-sourced reports
- ✓Pattern Recognition: AI identifies patterns humans might miss by analyzing thousands of data points simultaneously
- ✓Relative Signals: Zones help compare planning strength without pretending to guarantee a catch
- ✓Improving Context: As more data becomes available, models can be refreshed to improve planning usefulness
- ✓Easy to Understand: Color-coded visualization makes planning context easier to compare
Ready to Plan With Better Map Context?
Use heat maps as one more signal before you choose where to run.