Commercial Fishing Track Analytics
Analyze historical AIS tracks to see where commercial vessels operated, with pattern scoring, drift runs, and track context you can trust.
Commercial activity, distilled into clear signals
Fish Fathom turns dense AIS track history into a clean analytics view so you can understand how commercial fleets move, where they slow down, and which patterns repeat over time.
- ✓Track summaries: See vessel name, distance, average speed, and offshore range at a glance.
- ✓Pattern scoring: Highlight consistent movement that suggests productive fishing behavior.
- ✓Activity tags: Quickly filter for bottom fishing, trolling, or both.
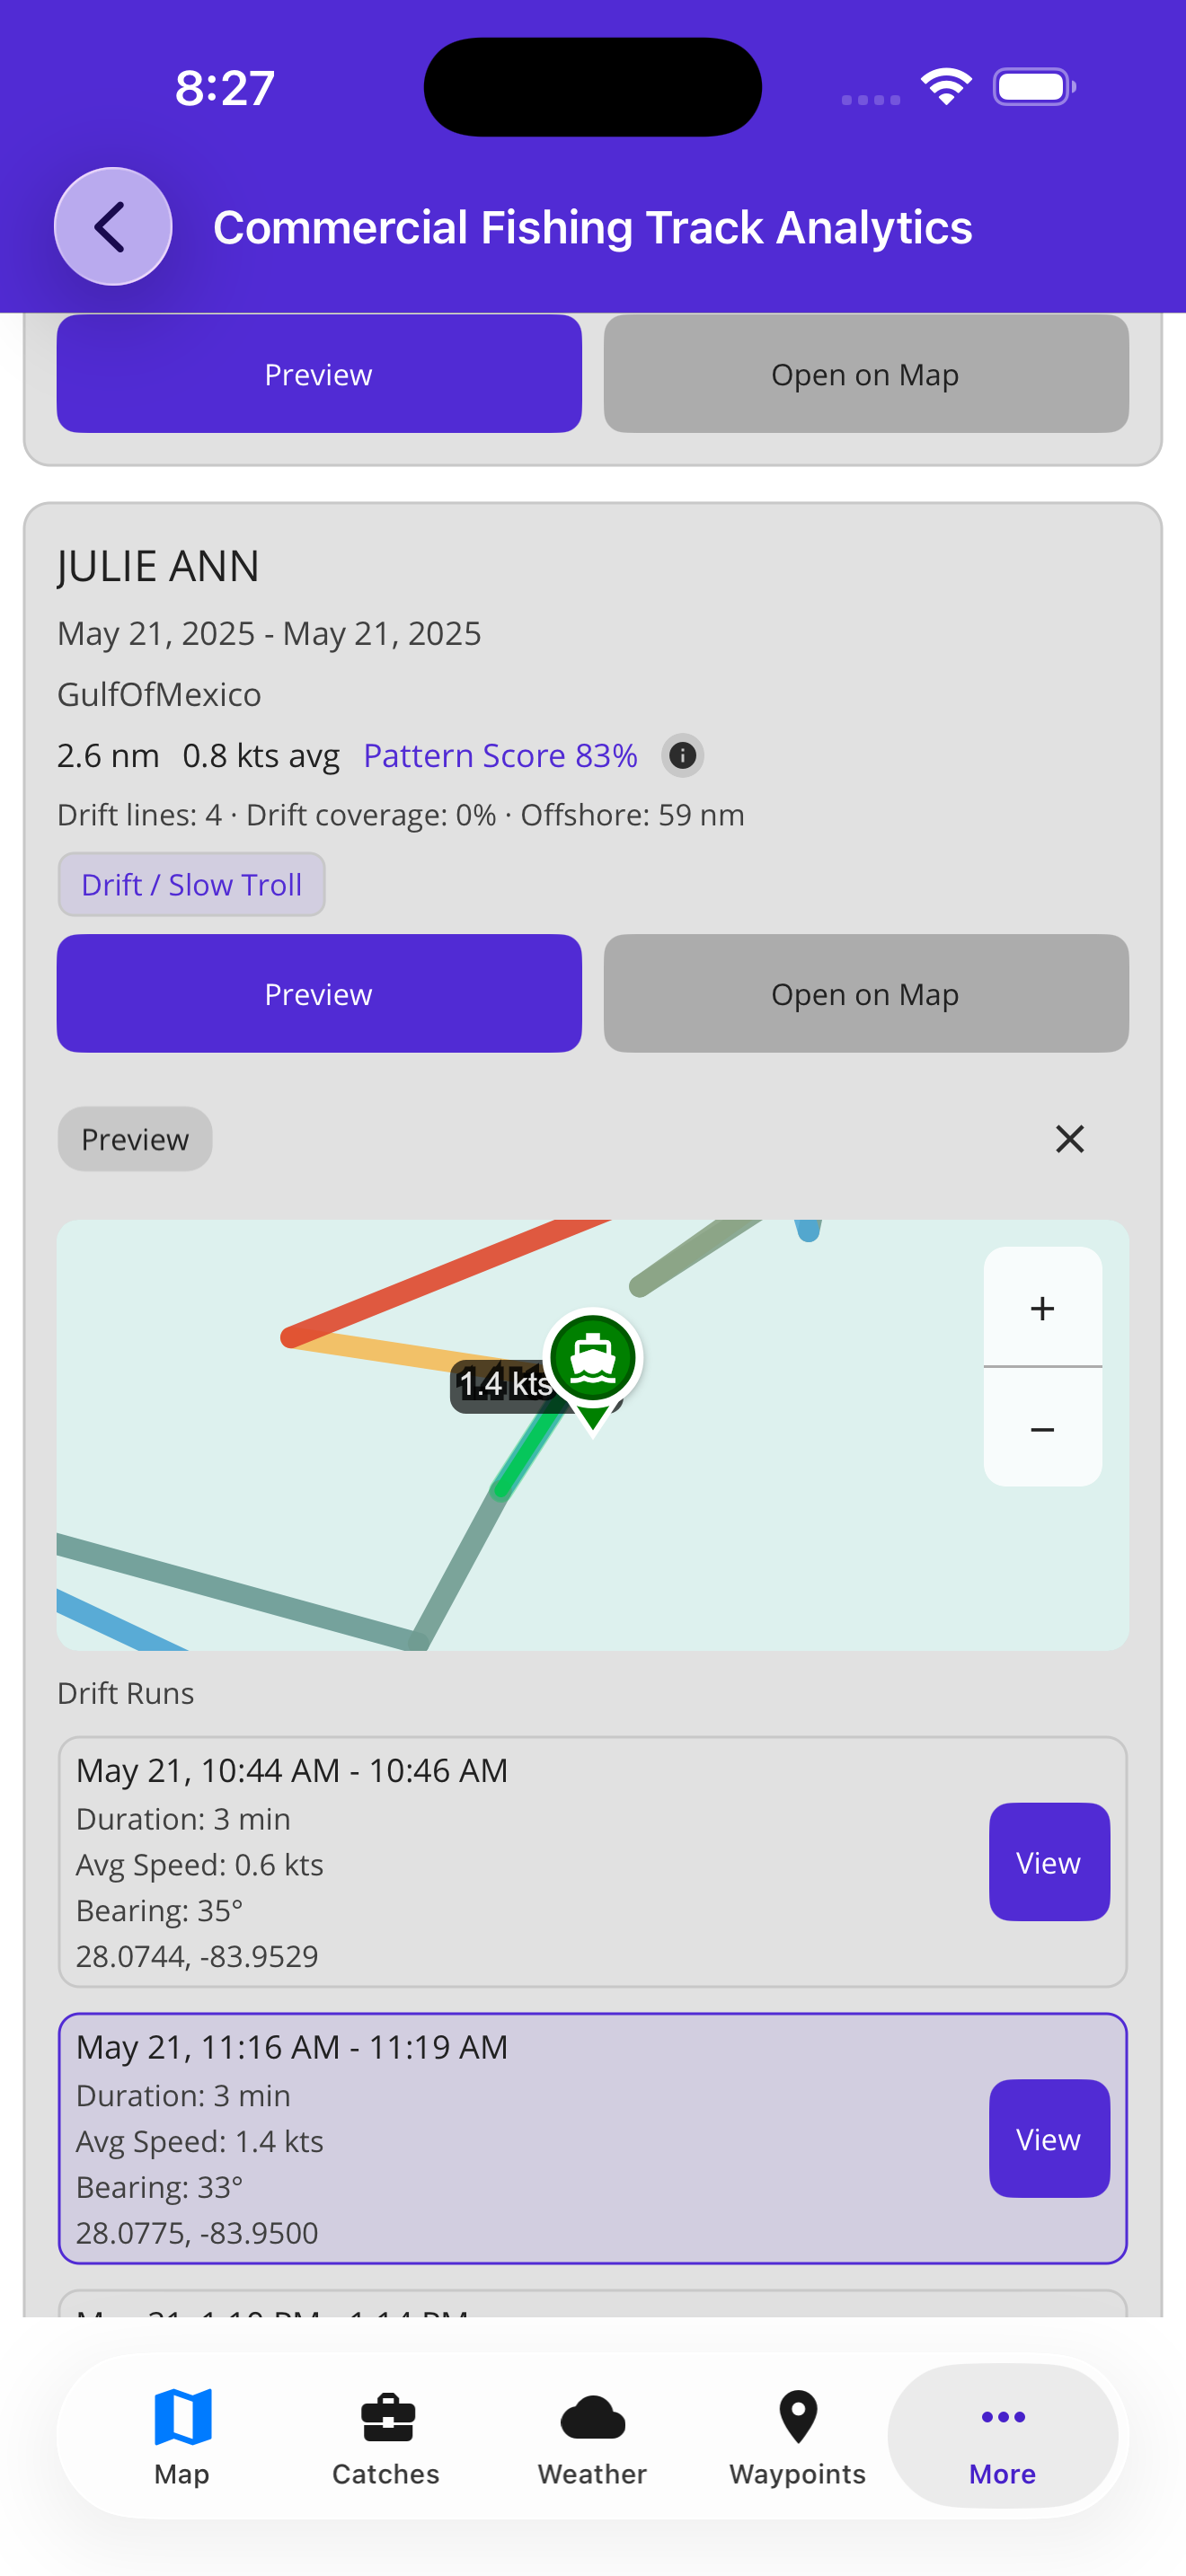
Track cards summarize patterns before you open the map.
What the analytics reveal
Pattern Score
Ranks repeatable movement so you can prioritize the most reliable tracks.
Drift Runs
Breaks down slow-drift and trolling segments with speed, bearing, and time-on-spot.
Offshore Context
Track distance from shore and vessel length to match your boat and fuel range.
Track Context
Review track summaries and AIS sampling context before opening detailed map views.
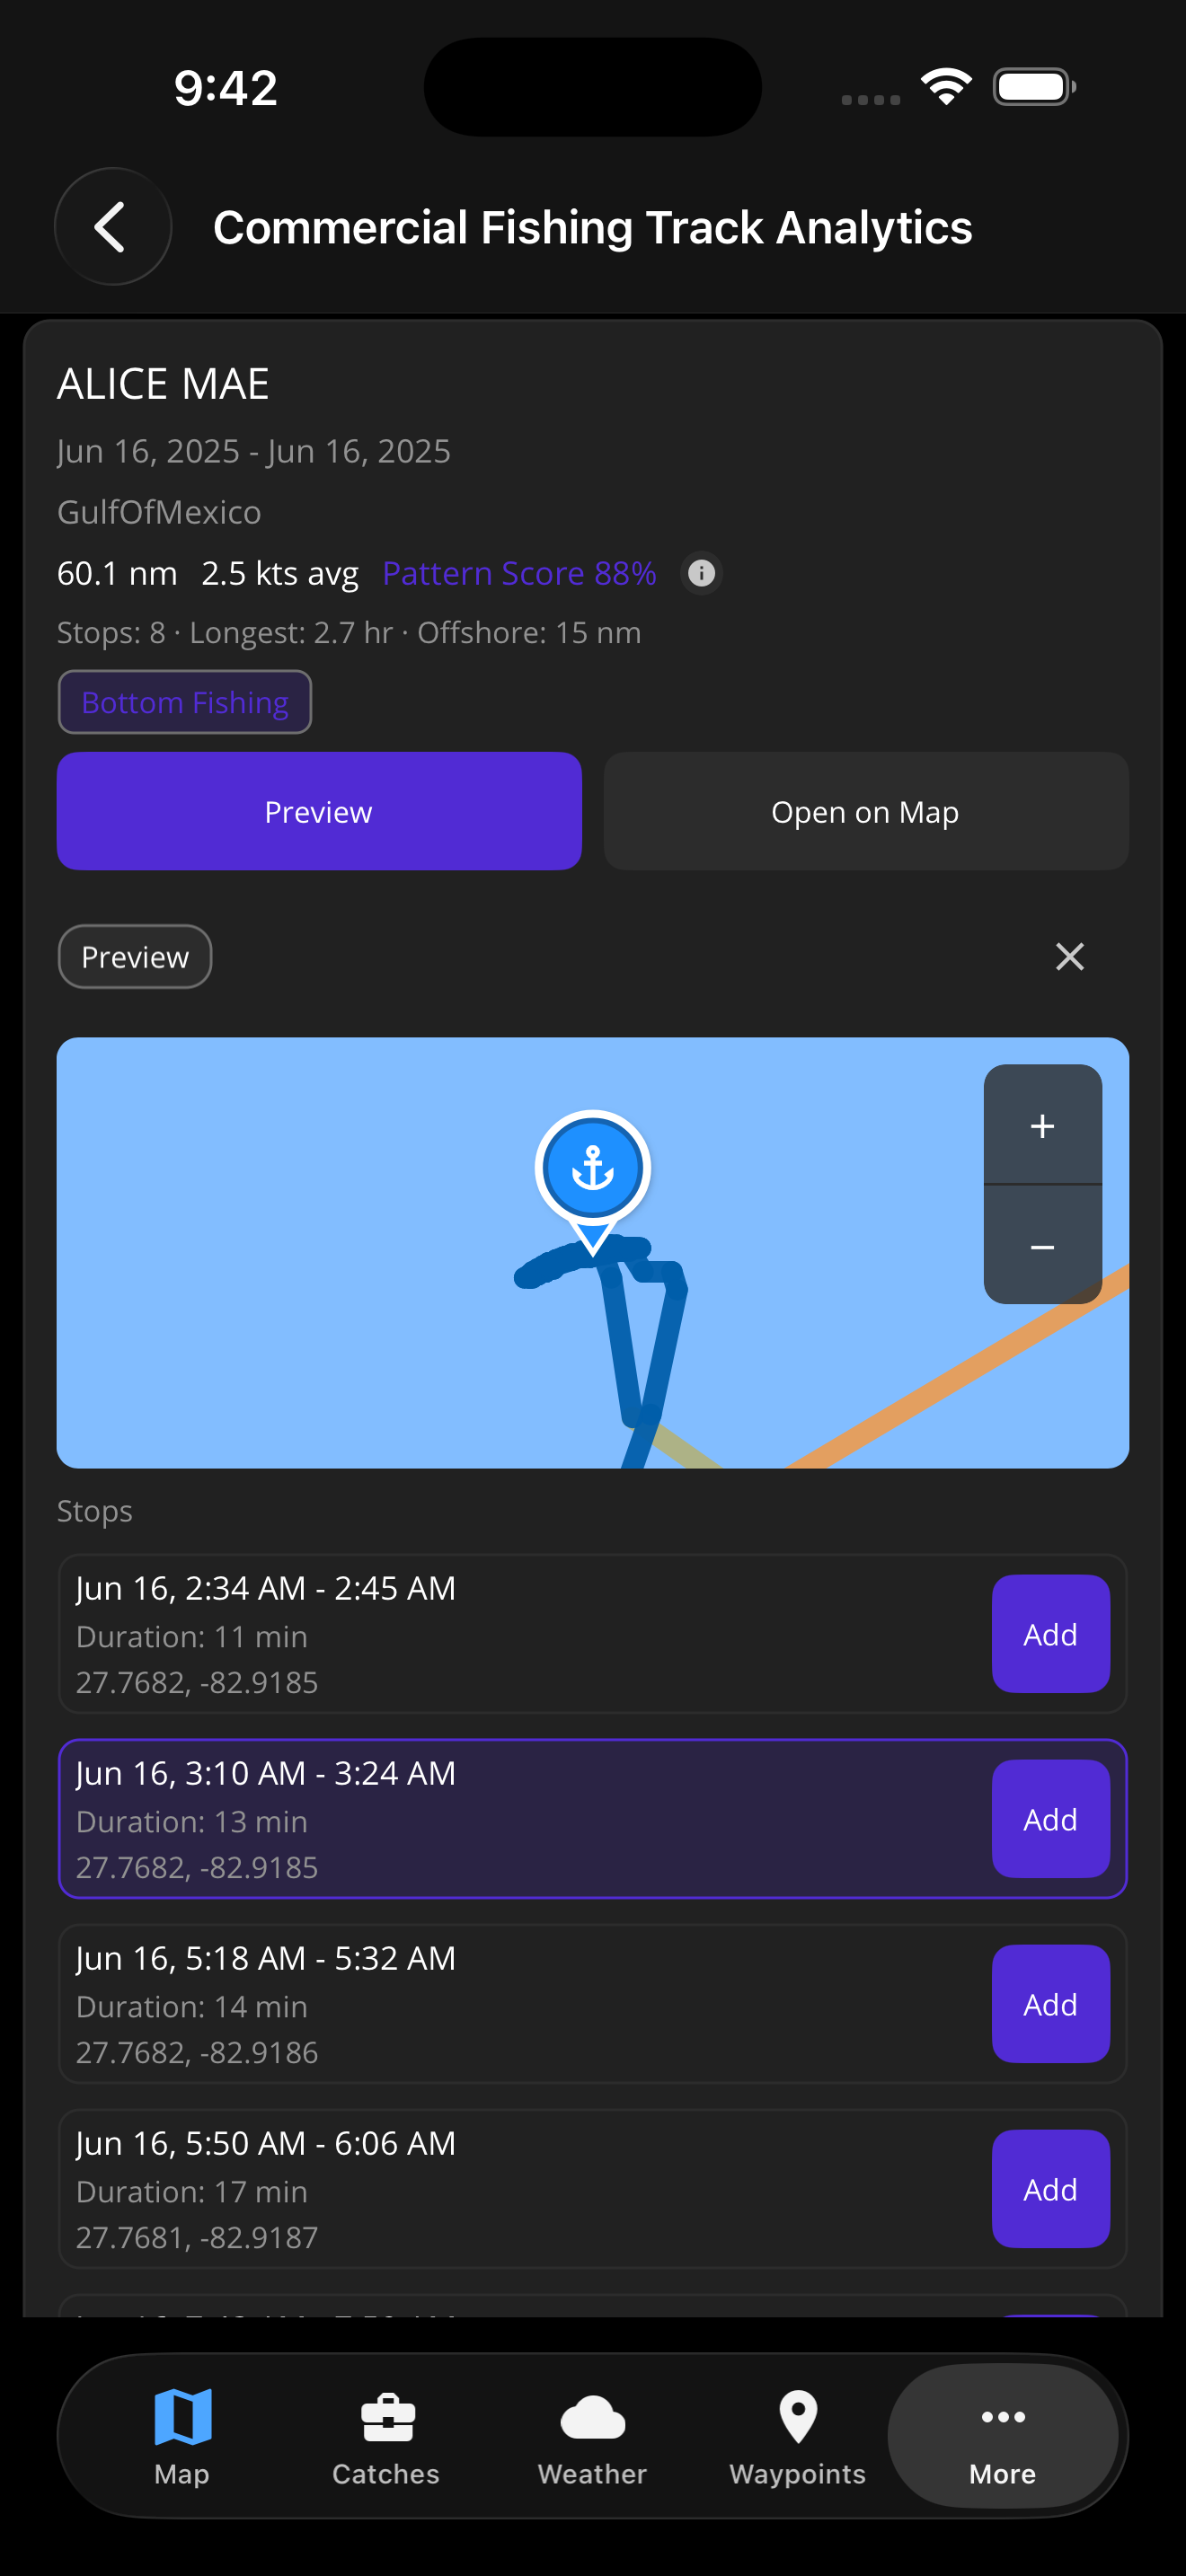
Candidate stop windows, ready to review
Track analytics surface low-speed stop windows with cards you can add to your plan. Review time windows, locations, and track context before deciding where to run.
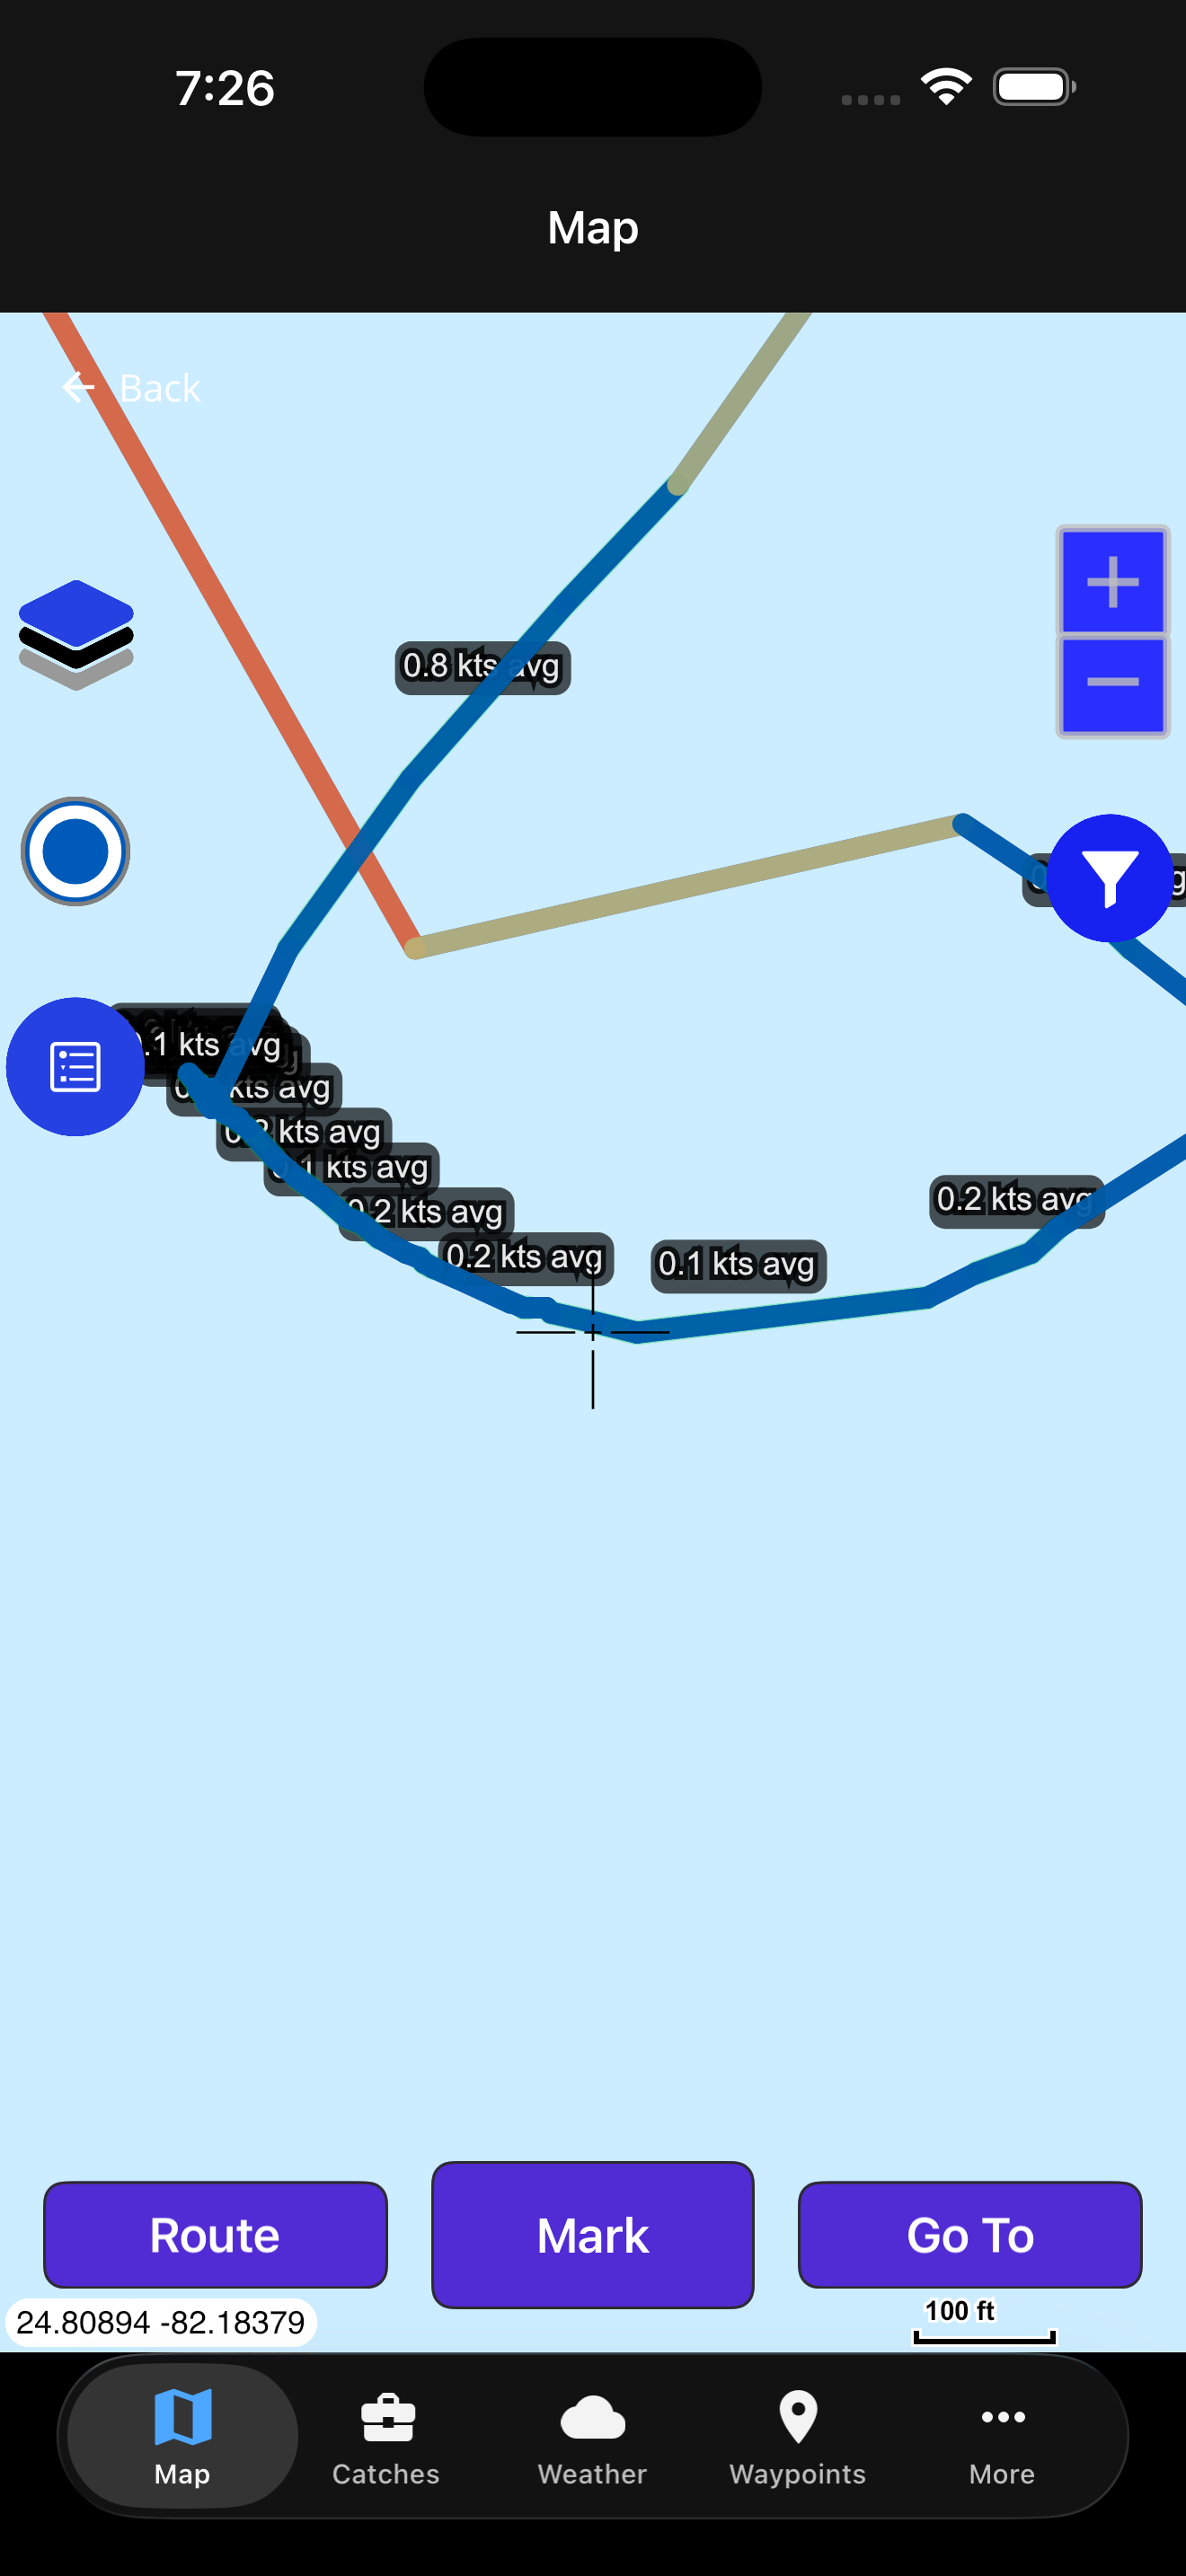
Preview tracks on the map
Overlay commercial tracks directly on your chart to compare corridors with your waypoints, routes, and structure layers. You can open a track on the map and build routes or stop waypoints from the best segments.
Filter the fleet your way
Narrow results to the vessels, time range, and activity that match your target fishery. Every result includes summary context so you can quickly decide what to inspect.
Track summary signals
- Vessel details: Name, vessel size, and other identifying context.
- Track metrics: Distance, speed, and activity summary by run.
- AIS samples: Point density and geometry context behind each track.
How to use commercial track analytics
Set your search area
Choose a center point and radius to focus on the grounds you care about.
Filter the fleet
Refine by vessel name, length, distance from shore, date range, and activity.
Review track cards
Compare pattern scores, drift runs, and summary context before opening the map.
Open on map
Overlay tracks on your charts and turn the best segments into routes or stops.
Commercial vessel tracking FAQ
Where does the commercial vessel data come from?
Fish Fathom analyzes historical AIS broadcasts from commercial fishing vessels and summarizes them into track intelligence.
Is this real-time vessel tracking?
No. The analytics focus on historical AIS tracks so you can study repeatable patterns and productive corridors.
What does the Pattern Score mean?
Pattern Score highlights consistency in speed and course. Higher scores indicate more repeatable fishing behavior.
Can I filter for bottom fishing versus trolling?
Yes. Use the activity filter to focus on bottom fishing, trolling, or both, then narrow by date and vessel size.
Ready to fish with commercial-grade intelligence?
Unlock a deeper view of where the fleet works and plan smarter trips.